|
|
 |
|
|
|
|
|
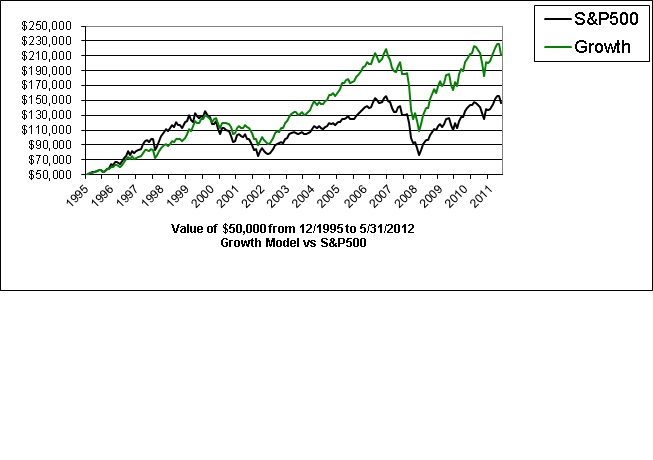
On December 1, 1995, Adviser Financial Group, Inc., constructed three diversified model portfolios, each with an initial investment of $50,000. These portfolios were built to test our theory that low cost, well-diversified investment portfolios of retail no-load mutual funds will out perform major stock and bond indexes over long time periods. Since the beginning of this experiment 16 years ago, we have been reporting the performance results and investment changes in this monthly newsletter, and we will continue to do so. Here is a summary of each model portfolio's performance relative to its objectives:
Growth Model Portfolio
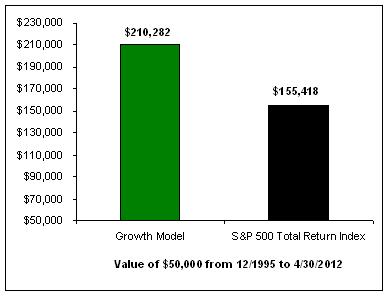
The goal of the Growth Model portfolio is to beat the S&P 500 Total Return index over the long-term with little or no concern for market volatility or short-term losses. This portfolio will remain fully invested in various stock mutual funds at all times. The Growth Model portfolio beat the S&P 500 Total Return for the past 12 months, and the objective of this portfolio has been accomplished since it was initially set up on December 1, 1995, as you can see below.
Special Note
The Growth portfolio is aimed at investors with long time horizons who can withstand a certain amount of monthly volatility in exchange for expected above market returns. Results take into consideration our customary advisory fees, brokerage costs normally incurred, and reinvestment of all dividends and interest. Client portfolios differ from our model portfolios based on individual needs and circumstances. Past performance is no indication of future performance. A complete listing of portfolio recommendations is available upon request.
Performance Compared to Index
| Growth Portfolio vs S&P
500 |
|
1-Yr |
3-Yr |
5-Yr |
Since 12/95 |
|---|
| Growth |
4.6% |
16.3% |
0.4% |
8.4% |
| S&P 500 |
7.8% |
14.1% |
0.2% |
6.5% |
Last Month's Performance Detail
| Growth Portfolio Performance � November 2011 |
| Fund |
Shares |
NAV |
Value |
% |
November 2011 Return |
| Vanguard Capital Opportunity |
835 |
$31.22 |
$26,075 |
13.1% |
-1.1% |
| Vanguard Index Trust 500 |
456 |
$115.28 |
$52,584 |
26.3% |
-0.2% |
| TR Price Small Co Stock |
530 |
$34.39 |
$18,232 |
9.0% |
0.6% |
| Vanguard International Growth |
2,234 |
$17.19 |
$39,399 |
19.3% |
-3.0% |
| Vanguard Health Care |
316 |
$132.64 |
$41,978 |
21.0% |
-0.1% |
| Cohen & Steers Realty (REIT) |
384 |
$58.72 |
$22,534 |
11.3% |
-4.0% |
| Total |
|
|
$199,802 |
100.0% |
-1.2% |
Annual Performance History
| Growth Portfolio Performance History |
| Year |
Annual % Return |
| Since 12/01/1995 | 8.4% |
| 2011 YTD | -1.3% |
| 2010 | 14.5% |
| 2009 | 31.8% |
| 2008 | -35.8% |
| 2007 | 3.9% |
| 2006 | 18.7% |
| 2005 | 9.7% |
| 2004 | 16.5% |
| 2003 | 32.1% |
| 2002 | -17.0% |
| 2001 | -8.6% |
| 2000 | 12.3% |
| 1999 | 23.4% |
| 1998 | 20.7% |
| 1997 | 21.8% |
| 1996 | 12.5% |
Top of Page
Conservative Growth Model Portfolio
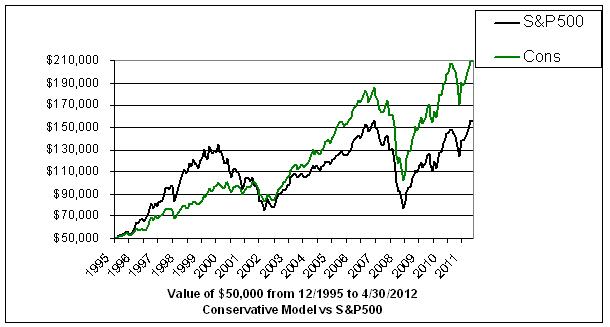
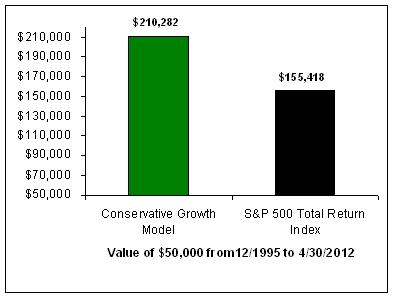
The goal of the Conservative Growth model portfolio is to equal the S&P 500 Total Return index over the long-term with the second goal of reducing volatility by 25%. The objective of lower volatility has been accomplished. The performance of the Conservative Growth model beat the S&P 500 Total Return for the past 12 months, and the performance objective for this model has been accomplished for all other time periods.
Special Note
The Conservative Growth Portfolio is appropriate for investors seeking to match the market's return over time with less volatility. Results take into consideration our customary advisory fees, brokerage costs normally incurred, and reinvestment of all dividends and interest. Client portfolios differ from our model portfolios based on individual needs and circumstances. Past performance is no indication of future performance. A complete listing of portfolio recommendations is available upon request.
Performance Compared to Index
| Conservative Growth Portfolio vs S&P
500 |
|
1-Yr |
3-Yr |
5-Yr |
Since 12/95 |
|---|
| Conservative Growth |
4.9% |
16.3% |
1.7% |
8.0% |
| S&P 500 |
7.8% |
14.1% |
-1.2% |
6.5% |
Last Month's Performance Detail
| Conservative Growth Portfolio Performance � November 2011 |
| Fund |
Shares |
NAV |
Value |
% |
November 2011 Return |
| Vanguard Index Trust 500 |
314 |
$115.28 |
$36,184 |
19.2% |
-0.2% |
| T.Rowe Price Small Co Stock |
1,311 |
$34.39 |
$45,074 |
24.0% |
0.6% |
| Vanguard International Growth |
2,058 |
$17.19 |
$35,370 |
18.8% |
-3.0% |
| Vanguard GNMA |
1,901 |
$11.16 |
$21,216 |
11.2% |
0.5% |
| Cohen & Steers Realty (REIT) |
539 |
$58.72 |
$31,639 |
16.8% |
-4.0% |
| Vanguard Health Care |
141 |
$132.64 |
$18,755 |
10.0% |
-0.1% |
| Total |
|
|
$188,238 |
100.0% |
-1.1% |
Annual Performance History
| Conservative Growth Portfolio Performance History |
| Year |
Annual % Return |
| Since 12/01/1995 | 8.0% |
| 2011 YTD | -0.6% |
| 2010 | 18.1% |
| 2009 | 28.3% |
| 2008 | -30.0% |
| 2007 | 2.4% |
| 2006 | 18.6% |
| 2005 | 9.0% |
| 2004 | 16.6% |
| 2003 | 25.8% |
| 2002 | -10.0% |
| 2001 | -3.2% |
| 2000 | 10.4% |
| 1999 | 13.6% |
| 1998 | 11.8% |
| 1997 | 21.4% |
| 1996 | 13.0% |
Top of Page
Income Model Portfolio
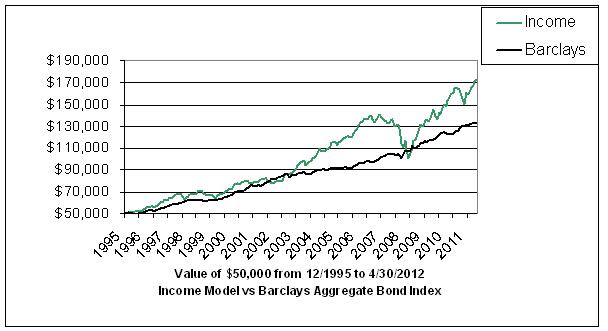
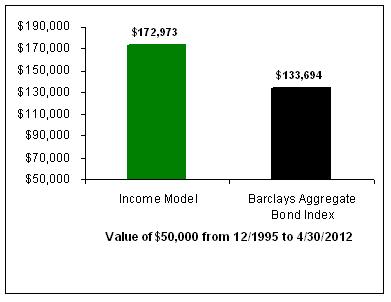
The goal of the Income Model portfolio is to provide a higher level of income plus provide a higher total return than the Lehman Aggregate Bond Total Return index. Both objectives have been met for all time periods. Although the objectives have been met since inception, the performance objectives for the Income Model portfolio have not outperformed the Barclays Aggregate Bond Total Return for 1 year, 3 year, and 5 year returns as can be seen in the following charts.
Special Note
The Income portfolio is designed for investors, such as retirees, or near-retirees, who desire a higher level of income plus the opportunity for capital growth with relatively low risk. Results take into consideration our customary advisory fees, brokerage costs normally incurred, and reinvestment of all dividends and interest. Client portfolios differ from our model portfolios based on individual needs and circumstances. Past performance is no indication of future performance. A complete listing of portfolio recommendations is available upon request.
Performance Compared to Index
| Income Portfolio vs Barclays Aggregate Bond |
|
1-Yr |
3-Yr |
5-Yr |
Since 12/95 |
|---|
| Income |
6.2% |
11.8% |
2.8% |
6.9% |
| Barclays Aggregate Bond Index |
3.5% |
2.2% |
2.4% |
2.5% |
Last Month's Performance Detail
| Income Portfolio Performance- November 2011 |
| Fund |
Shares |
NAV |
Value |
% |
November 2011 Return |
| Vanguard Windsor II |
1,919 |
$25.69 |
$49,288 |
31.0% |
0.0% |
| Cohen & Steer Realty (REIT) |
652 |
$58.72 |
$38,302 |
24.3% |
-4.0% |
| Vanguard GNMA |
2,489 |
$11.16 |
$27,777 |
17.5% |
0.5% |
| Vanguard Total Bond Index |
2,579 |
$10.96 |
$28,263 |
17.8% |
-0.3% |
| TR Price International Bond |
1,503 |
$9.95 |
$14,961 |
9.4% |
-2.8% |
| Total |
|
|
$158,591 |
100.0% |
-1.2% |
Annual Performance History
| Income Portfolio Performance History |
| Year |
Annual % Return |
| Since 12/01/1995 | 6.9% |
| 2011 YTD | 3.0% |
| 2010 | 11.5% |
| 2009 | 16.7% % |
| 2008 | -14.4% |
| 2007 | 0.0% |
| 2006 | 16.0% |
| 2005 | 4.2% |
| 2004 | 15.8% |
| 2003 | 17.9% |
| 2002 | 0.2% |
| 2001 | 2.4% |
| 2000 | 14.0% |
| 1999 | -2.9% |
| 1998 | 4.9% |
| 1997 | 15.9% |
| 1996 | 9.9% |
Top of Page
|
|
|
 |
| |
| | | | |